Reading Time | 10 Minutes
Every 60 to 90 days, a corrosion coupon comes out of your cooling tower — weighed, analyzed, and sent back to you as a report. In most facilities, that report gets filed without anyone reading it closely. That’s a problem.
Left unchecked, the corrosion those numbers describe will eat through pipe walls and heat exchanger tubes quietly and expensively, until it becomes an emergency. A corrosion coupon report is one of the clearest signals your water treatment program will ever give you. Once you know what the numbers mean, it stops being a formality and starts being a management tool.
This guide breaks it down: what corrosion coupons measure, how to read every field on the report, what the thresholds mean, and what to do when the numbers are off.
A corrosion coupon report is a lab analysis that quantifies how much metal your cooling tower water is destroying over time. A small, precisely pre-weighed piece of metal — usually mild steel, copper, or both — is inserted into the system for 60 to 90 days, then removed, cleaned, and reweighed. The weight loss is converted into an annualized rate expressed in mils per year (MPY), giving your water treatment program a real-world measure of whether your metals are protected.
Think of it as a controlled experiment running inside your actual system — not in a beaker. A water chemistry test measures what’s in the water. A corrosion coupon tells you what that water is doing to your equipment.
Why Coupons Over Chemistry Tests Alone?
Water chemistry can look fine while corrosion is still happening — especially in areas with uneven flow, dead legs, or localized biological activity. Coupons catch what chemistry tests miss. Both belong in a well-run program.
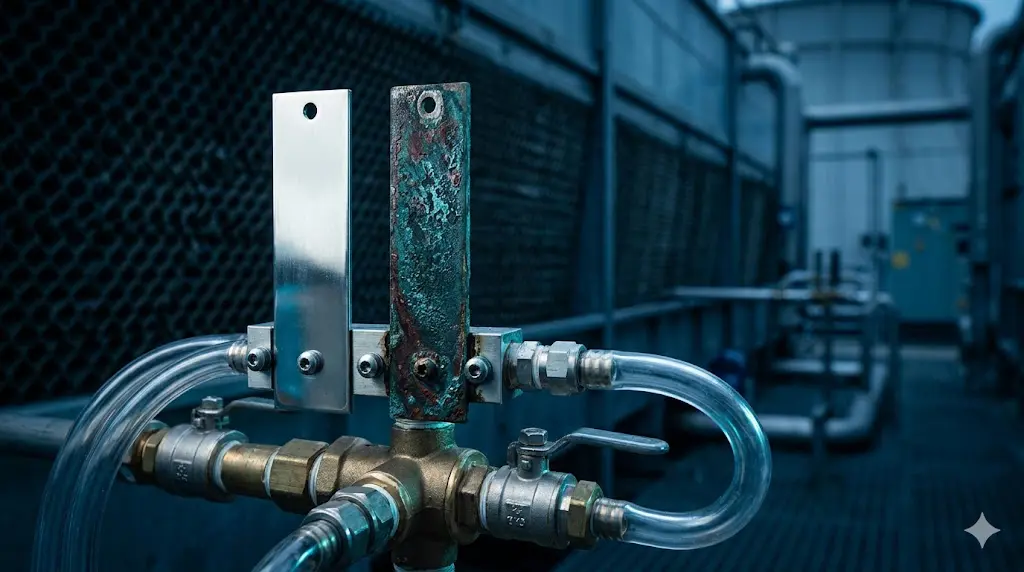
Standard placement: bypass rack at tower return. Exposure time: 60–90 days minimum for meaningful results.
Not sure if your corrosion rates are where they should be?
A free water analysis gives you a clear baseline — chemistry, metals, and treatment program performance reviewed by a ChemREADY specialist.
The primary output of any corrosion coupon report is the corrosion rate in mils per year (MPY) — thousandths of an inch of metal lost per year. Industry benchmarks for cooling tower systems are:
| Metal | Rate (MPY) | Status | What It Means |
|---|---|---|---|
| Mild Steel | Under 3 | ✓ Good | Inhibitor program is working. Metal is protected. |
| Mild Steel | 3 – 5 | ⚠ Marginal | Investigate inhibitor residuals and pH control. |
| Mild Steel | Over 5 | ✕ Action Required | System corroding at damaging rate — program adjustment needed immediately. |
| Copper / Copper Alloy | Under 0.5 | ✓ Good | Normal for a well-controlled system. |
| Copper / Copper Alloy | 0.5 – 1.0 | ⚠ Marginal | Review pH and oxidant levels. Check azole residuals. |
| Copper / Copper Alloy | Over 1.0 | ✕ Action Required | Copper loss will damage heat exchangers. Immediate review required. |
MPY is an annualized rate, which means a coupon pulled at 60 days and one pulled at 90 days produce directly comparable numbers. That’s intentional — it lets your water treatment provider spot trends over time without results being skewed by exposure duration.
If your report doesn’t show a target range next to the result, ask for one. It should always be there.
Seeing elevated corrosion rates and not sure why?
ChemREADY’s cooling tower specialists can review your program chemistry, inhibitor residuals, and coupon history to find what’s driving the problem.
Beyond the MPY number, a complete corrosion coupon report includes several additional fields. Each one adds context:
| Field | What It’s Telling You |
|---|---|
| Coupon Weight Loss | Actual grams lost during the exposure period. Used to calculate MPY — not meaningful on its own without the rate conversion. |
| Exposure Time | Days the coupon was installed. Under 30 days is too short for reliable data. 60–90 days is the standard for cooling towers. |
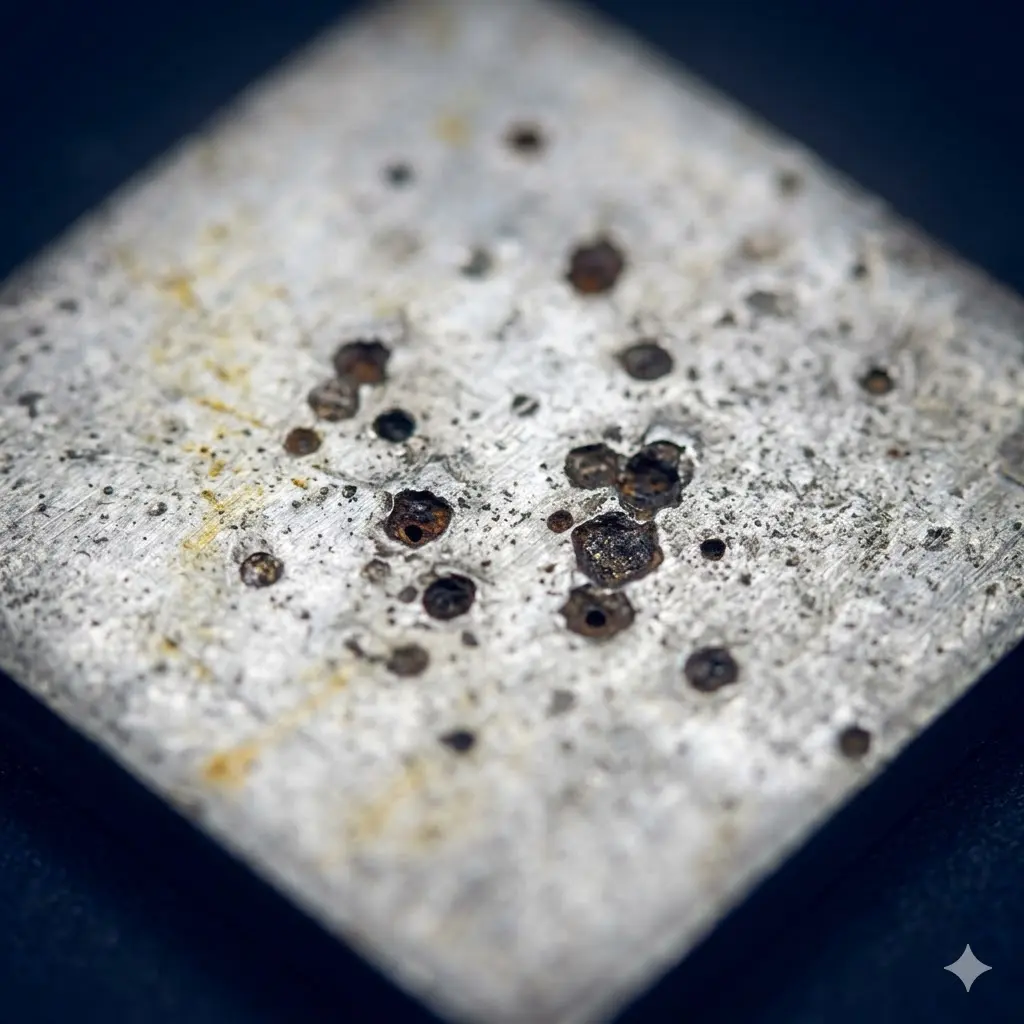
| Coupon Appearance | Visual lab notes: pitting, staining, deposits, or biological film. A clean coupon with low MPY is the target. Pitting warrants attention even at low overall rates. |
| Deposit Analysis | Identifies what’s on the coupon — scale, iron oxide, biological film. Helps pinpoint root cause when rates are elevated. |
| Pitting Notation | Separate from overall corrosion rate. Pitting is localized and punches through metal much faster than the average rate suggests. |
Pitting vs. Uniform Corrosion — Why It Matters More Than the MPY
Uniform corrosion removes metal evenly. Pitting concentrates corrosive attack in one spot — it can perforate a pipe wall or heat exchanger tube while the overall MPY still looks acceptable.
A coupon showing 1.5 MPY with significant pitting is a more urgent concern than one showing 3.5 MPY with a clean, uniform surface. Always read the visual appearance notes alongside the rate.
Not every loop needs a MagStrainer on day one. These are the situations where it moves from optional to important:
A full flush removes bulk contamination, but fine magnetite embedded in pipe walls and low-flow zones continues shedding into the water for weeks as the system stabilizes. Magnetic filtration catches that ongoing shed-out before it re-deposits in equipment. Learn more about the full sequence in our water management planning guide.
If water tests show iron rising between service visits — even with a working inhibitor program — circulating particulate is often the cause. Adding filtration frequently resolves this without any chemistry changes.
A strainer that needs cleaning every few weeks is telling you there’s a significant amount of loose material in the loop. That same material is circulating between cleanings. A side-stream MagStrainer reduces main strainer frequency and catches what the strainer misses.
A loop with past corrosion problems has deposits throughout the piping that will continue releasing particles over time. Ongoing magnetic filtration is a practical way to manage background contamination without a full system replacement. Pair with digital remote monitoring for full visibility between service visits.
Want to know how your cooling tower is really doing?
ChemREADY delivers complete cooling tower water treatment programs — corrosion coupon monitoring, water analysis, and documented reporting by specialists who know your system.
If your report comes back with a rate above the acceptable threshold, there are five common causes your water treatment provider should be investigating. Knowing these helps you ask the right questions:
None of these require a crisis response in isolation. But when your corrosion coupon report shows a rate trending upward over two or more pull cycles, these are the five levers your treatment provider should be adjusting — and documenting.
If you have a recent corrosion coupon report in front of you, work through this checklist:
A corrosion coupon report shouldn’t be a mystery document that gets filed and forgotten. It’s one of the most direct indicators of whether your cooling tower treatment program is actually protecting your equipment. Once you know how to read it, it becomes a management tool — not a formality.
Book a 30-minute conversation directly. We'll discuss your water treatment situation and whether working together makes sense.
Book a 30-minute call →Take a look at our water treatment services first. See where you stand across chemical programs, system performance, and municipal compliance — then decide if a conversation makes sense.
Find out what a buyer would see →Browse everything we do in water treatment — chemicals, equipment, and services — at your own pace, no conversation required.
Explore our water treatment solutions →We work with advisors who encounter infrastructure gaps in municipal water and drinking water client businesses. If you're looking for a referral partner for pre-sale readiness work, let's talk.
Learn about our partner program →